Gistory
gistory
![]()
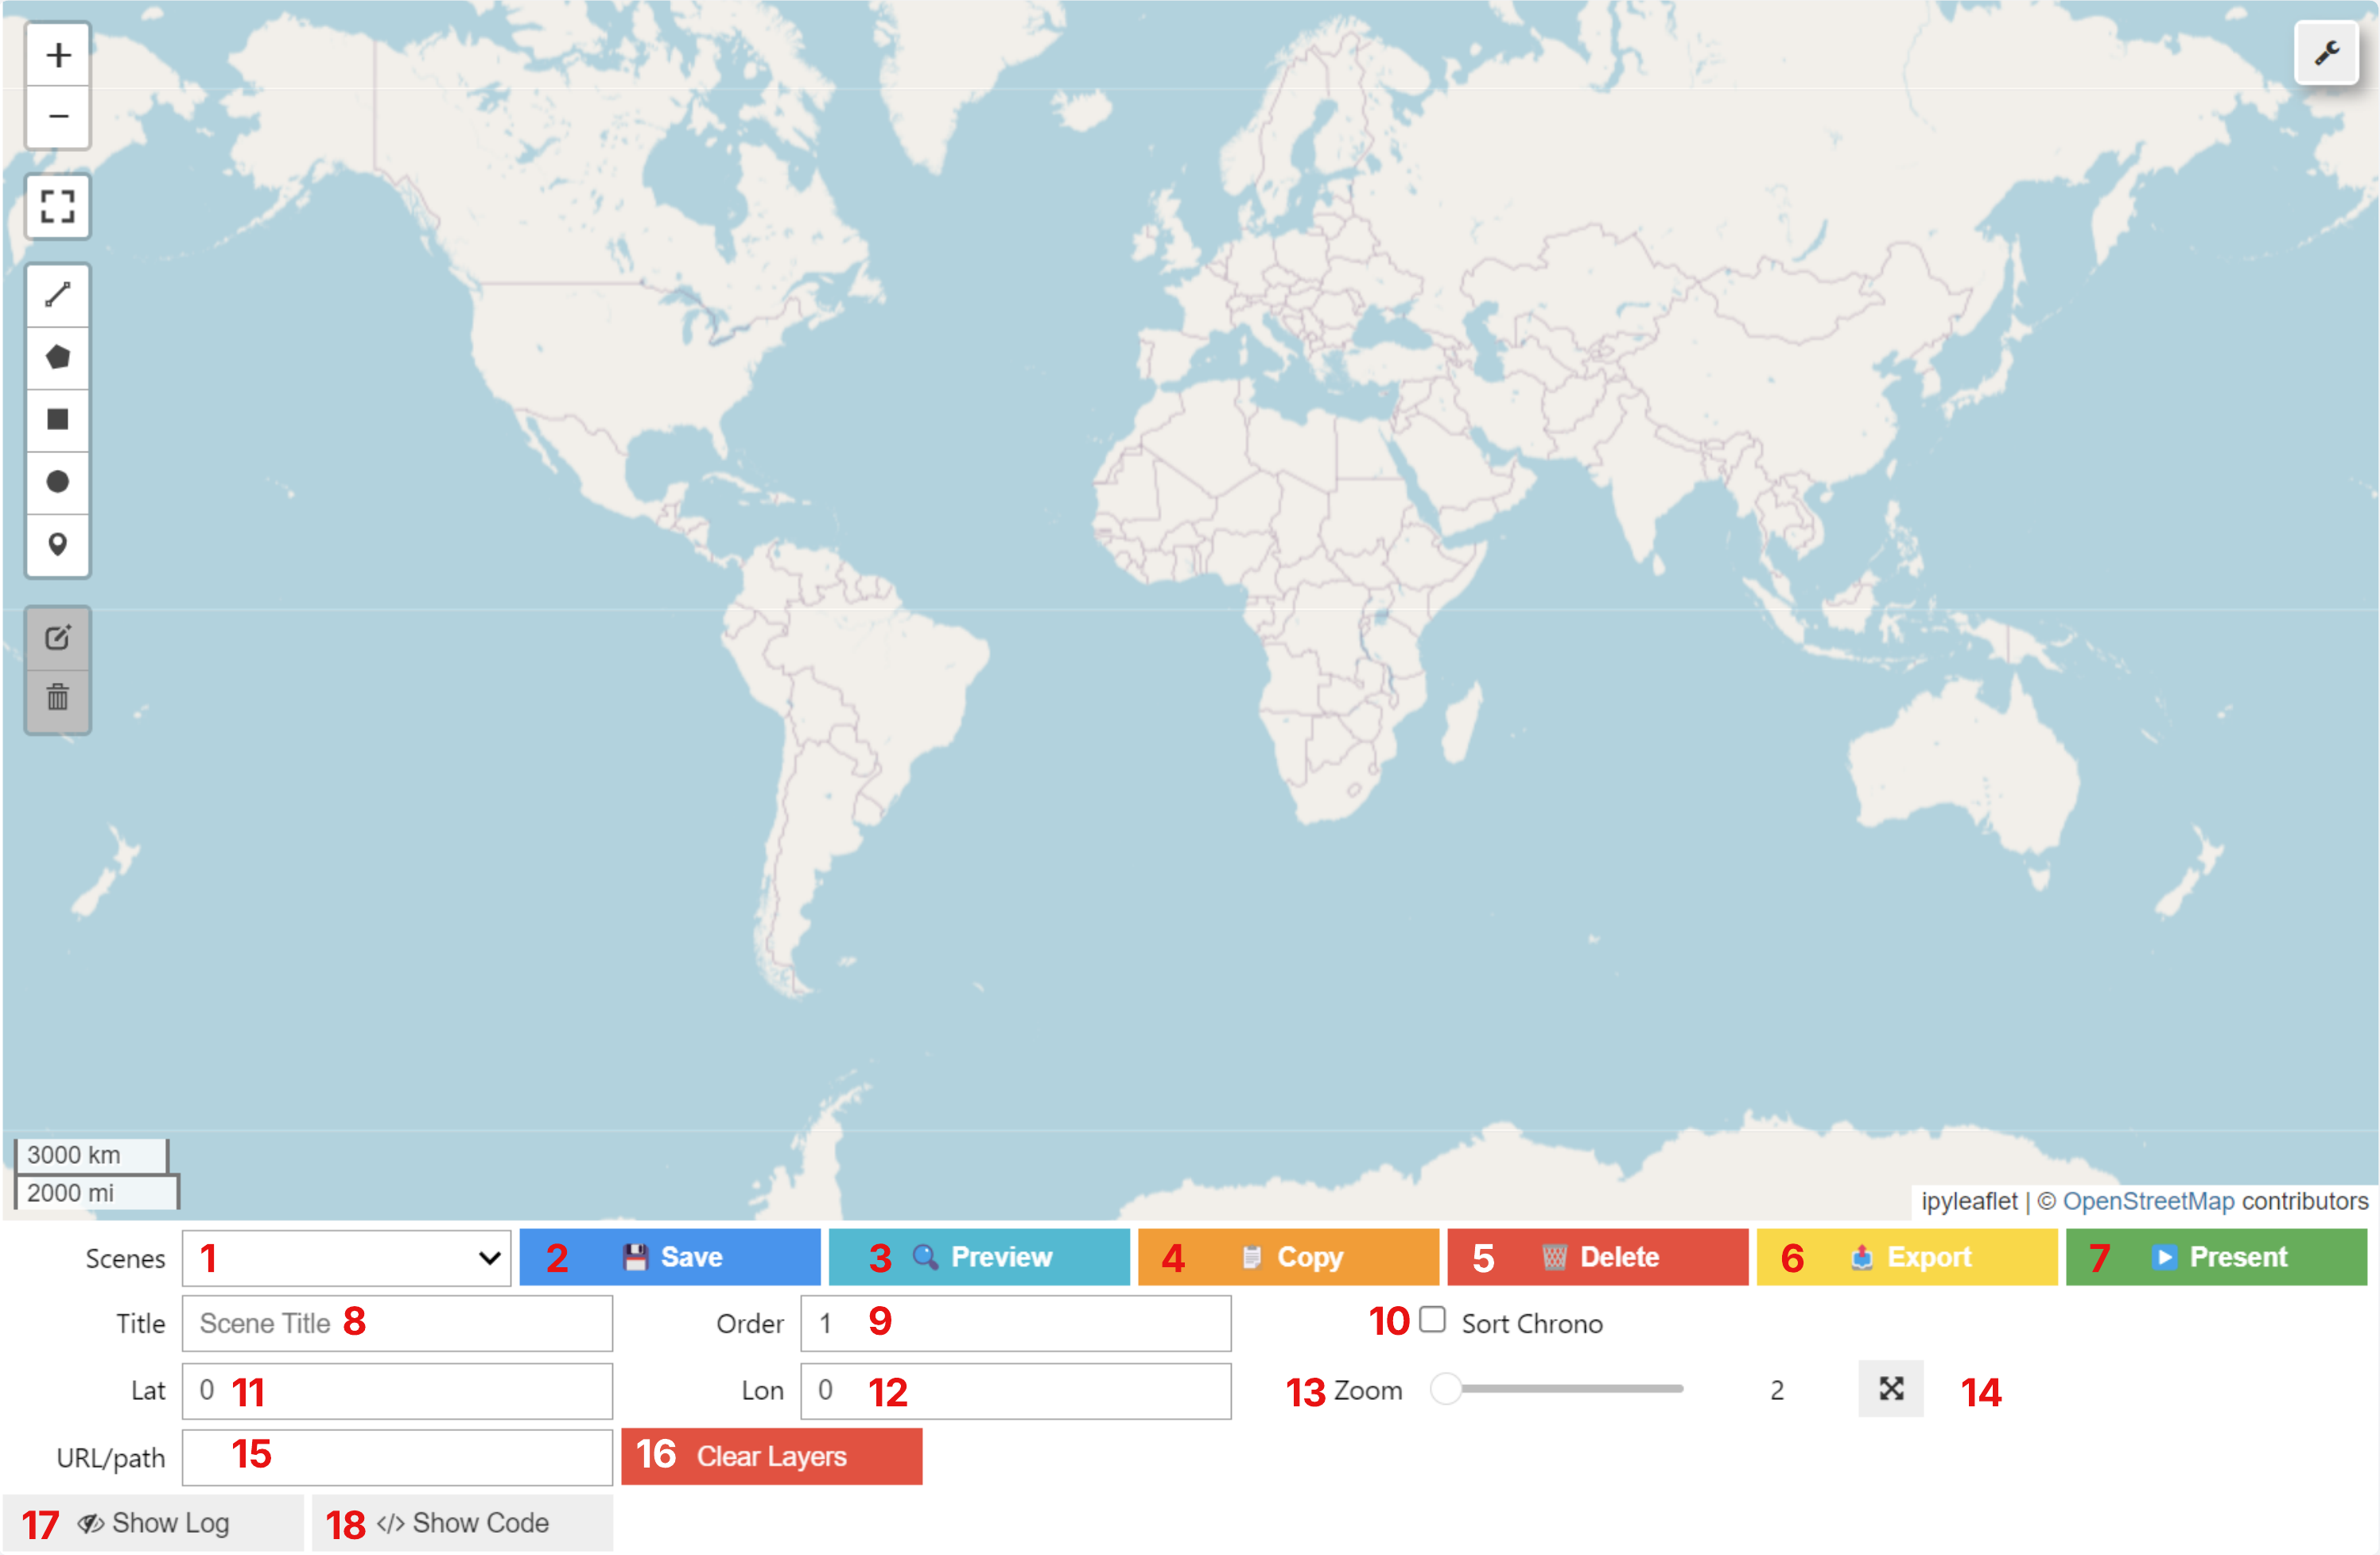
Scenes dropdown selector Choose which saved scene you want to load or edit.
Save button Persist the current map view and settings to the selected scene.
Preview button Open a live preview of the scene in a new pane or widget.
Copy button Duplicate the current scene’s settings into a new entry.
Delete button Remove the currently selected scene from your list.
Export button Download or export the scene’s data (e.g. GeoJSON, JSON).
Present button Launch a full‑screen presentation mode cycling through scenes.
Title text input Edit the human‑readable name of the current scene.
Order numeric input Specify the sequence position of this scene in presentations.
Sort Chrono checkbox Automatically sort scenes by their order value.
Lat numeric input Set the scene’s center latitude coordinate (automatically updates).
Lon numeric input Set the scene’s center longitude coordinate (automatically updates).
Zoom slider Adjust the map’s zoom level for this scene (automatically updates).
Fullscreen toggle Expand or contract the map view to fill the notebook cell.
URL/path text input Link to external imagery or load a local tile layer.
Clear Layers button Remove all added map layers from the current scene.
Show Log toggle Display or hide the action/event log for debugging.
Show Code toggle Open interactive python terminal connected to map/scene.
SceneBuilder
## Uncomment the next line to install maeson
# %pip install --upgrade maeson
The maeson package's user interface is stored within the gistory module. This presentation application is designed to accommodate to all levels of geographic expertise. By accessing web- or locally-hosted files, you can display GeoJSON vectors, raster files, images, videos, and (by using the code editor) any data hosted within the Google Earth Engine Data Catalog.
The first code block comprises the entirety of what is required to begin creating awesome geographic presentations! Once you import your necessary package and module, you just need 3 lines of code:
- Create an interactive map with the base maeson.Map() class.
- Connect the SceneBuilder class to the map.
- Display the builder.
The second code block contains example data to visualize to get familiar with the interface.
- Raster Layer: (C) Copy and paste url into the URL/path box -> (P) click Preview
- Vector Layer: C -> P
- Image Layer: C -> (B) Bounds slider populates; choose preferred bounds -> P
- Video Layer: [Currently Broken] C -> B -> P
- Earth Engine Layer: (E) Open Code Editor -> (U) Uncomment desired code block -> (C) into code editor -> P
## Uncomment the next line to use Earth Engine
# %pip install --upgrade earthengine-api
# import ee
# ee.Authenticate()
# ee.Initialize(project="your-cloud-project")

import maeson
from maeson.gistory import SceneBuilder

m = maeson.Map(center=(0, 0), zoom=2)
builder = SceneBuilder(m)
builder.display()
## Raster layer
# https://github.com/opengeos/datasets/releases/download/samgeo/tree_image.tif

## Vector layer
# https://github.com/opengeos/datasets/releases/download/vector/TN_Counties.geojson

## Video layer
# https://github.com/opengeos/datasets/releases/download/videos/aral_sea_blended.mp4

## Image layer
# https://i.imgur.com/06Q1fSz.png
# ((13, -130), (32, -100))

# # June 2021 Sentinel‑2 mosaic
# import ee
# ee.Initialize()
# sentinel = (
#     ee.ImageCollection("COPERNICUS/S2_SR")
#       .filterDate("2021-06-01", "2021-06-30")
#       .filterBounds(ee.Geometry.Point(-122.4, 37.8))
# )

# map.add_earthengine(
#     ee_object=sentinel,
#     vis_params={
#         "bands": ["B4", "B3", "B2"],
#         "min": 0,
#         "max": 3000
#     },
#     name="Sentinel-2 True Color (Jun 2021)"
# )

# Annual mean NDVI from MODIS
# import ee
# ee.Initialize()
# ndvi = (
#     ee.ImageCollection("MODIS/006/MOD13A1")
#       .select("NDVI")
#       .filterDate("2021-01-01", "2021-12-31")
#       .mean()
# )

# map.add_earthengine(
#     ee_object=ndvi,
#     vis_params={
#         "min": 0,
#         "max": 9000,
#         "palette": ["white", "yellow", "green"]
#     },
#     name="MODIS NDVI 2021"
# )